We used QGIS to generate a map of UK DTT (Freeview) transmission sites using data from Ofcom at NJH's Github gist. You can find and download these maps below.
About the data
These maps show the relative powers of each site. They doesn't attempt to predict reception coverage, as the Ofcom data doesn't provide enough detail.
To estimate reception coverage, you'd need to know at least:
- Details of each transmission station's gain in any given direction. At the moment, the map can only presume equal distribution of the signal in all directions.
- The shape and heights of hills.
- The amount of urban clutter in any area.
- The minimum signal level required to successfully decode a multiplex. For this, you'd probably have to presume a slightly higher signal level reaching the viewer's antenna in order to factor in signal loss on the download to the receiver.
From that, you could have a pretty good estimation of coverage. There would be a lot of calculations to perform, but if you were to break the problem down into small cells of area, there's likely scope for considerable parallel processing.
A fun project for anyone with that data.
As we don't have this data, we can generate comparative maps of power levels and enjoy the almost art-deco results.
If you want to print out your own high-resolution versions, you can download the PDFs below. Alternatively, you can find stickers, posters and T-shirts on RedBubble.
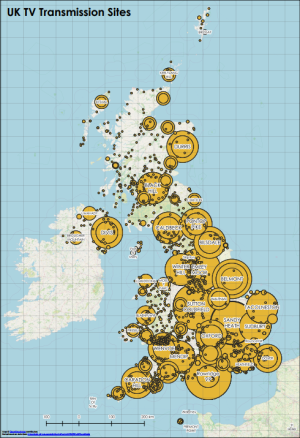
UK DTT Transmission power levels
A map of the UK's DTT (Freeview) transmission stations, comparing power levels.
Download PDF (13mb)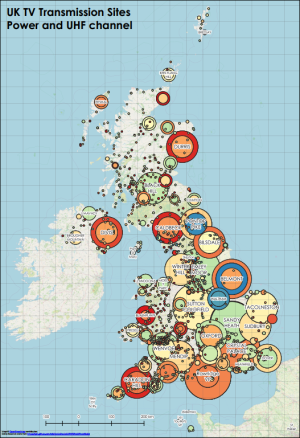
UK DTT Transmission frequency and power levels
A map of the UK's DTT (Freeview) transmission stations, comparing power levels and transmission frequencies.
Download PDF (13mb)The basemap data is © OpenStreetMap contributors. Anyone can edit and improve the OSM map. Give it a try!
Steps to create these maps
Here's what we did for anyone wishing to replicate these maps:
- Downloaded NJH's Github gist CSV of Ofcom data.
- Converted the OS Grid References in that file to latitude and longitude using gridreferencefinder.com.
- Used Excel to:
- Make the CSV file QGIS-friendly by removing the subheadings etc.
- Manually look-up and fix any missing latitude and longitude values.
These turned out to be all the transmission stations on the Channel Islands, as their OS Grid References aren't understood by gridreferencefinder.com. - Add an extra column named Label and use this column to add flags (large and small) for the transmission sites we want to label.
- Imported this updated CSV file into QGIS.
- Added an XYZ Tilemap of OpenStreetMap behind the CSV layer.
- Created a Simple Marker based on the Power column of the CSV and made its size data-driven. For the map with UHF channel allocations, the symbol was data-driven by size (Power) and colour (UHF Channel).
- Created a rule-based label using the Label column to display the sites that we chose to name. These labels were set to wrap on the space character.